Problem Description:
This experiment generates a simulated light spectrum of hydrogen. You must run this at least 5 minutes and take a snapshot of your experimental results. You will then look at spectra predicted by different models of the atom. You will test Dalton's Billiard Ball model, Classical Solar System Model, Bohr's Model of Hydrogen and Schrodinger's Model.
You will examine the different models of hydrogen atom, consider the emission spectrum generated and compare it to the YOUR experimental emission spectra above. You will use a snapshot you took of the experimental spectrum wavelength for this comparison.
This lab derives from material covered in Unit 4, Lessons 17 through 19. To complete the lab, go to the PhET model at http://phet.colorado.edu/en/simulation/hydrogen-atom.
Introduction:
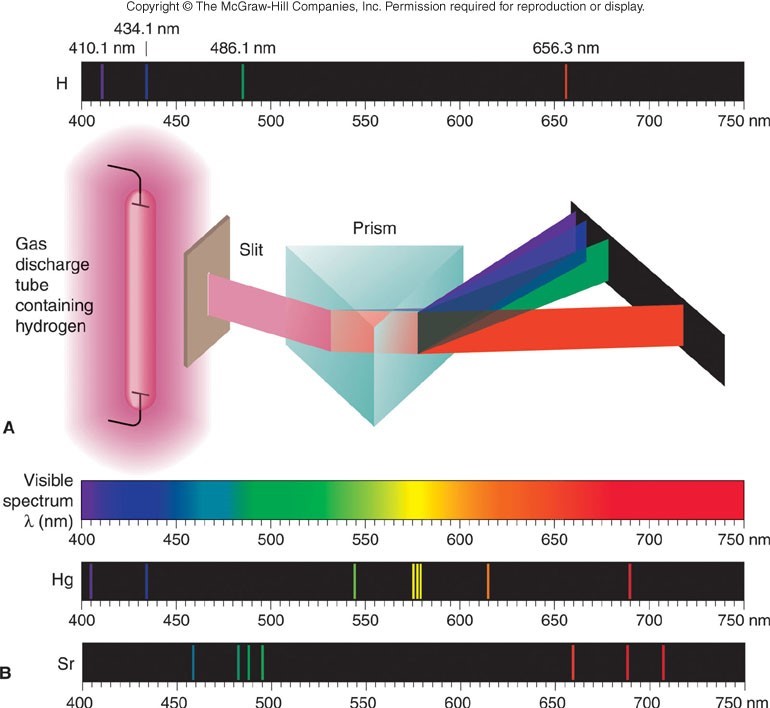
When light from the Sun or white light is passed through a prism it produces a "rainbow" of different colors. This has been known for centuries, with Isaac Newton making significant advances in the area of "Opticks" in the 1700's by investigating how light is reflected, refracted, dispersed, etc.
However, something very different occurs when a photon of light from a single element is emitted and passed through a prism. In this case only a small number of discrete lines are observed.

Even more remarkably, the pattern of these lines is a defining characteristic of each element. Here are the atomic spectra of mercury and strontium as examples. Each has its own discreet lines at particular wavelengths. The lines represent the photon of energy that is emitted from the atom.
What happens when light is emitted from an element like hydrogen? As you will see in this investigation, the answering of this question has led to profound insights into the electronic structure of the atom and, in turn, our modern understanding of chemistry.
The emission of photons (particles of light) from atoms is thought to occur in the following way: First, the atom absorbs energy and an electron moves to a higher energy level, or "excited state." When the electron eventually returns to a lower energy state, energy is released. The specific amount of energy released corresponds to the difference between the energy levels. When this energy difference corresponds to visible light then our eyes can observe color. It is also possible the emitted photons will have energies we cannot see, such as in the infrared or ultraviolet regions of the electromagnetic spectrum.
Atoms can absorb energy in various forms (heat, electrical, radiant) and subsequently emit photons. Today, in this investigation, you will complete activities that involve radiant energy (photons of light). The atoms absorb and emit photons of energy. We use the emission spectrum to identify changes in energy.
Laboratory Instrumentation:
The instrument used to view line spectra is a spectrometer. Photons emitted from the atoms in their excited states strike the prism and separates the light based on their particular wavelength. The resulting spectrum is superimposed on a scale and is viewed through the eyepiece. Note, only the visible light portion of the spectrum is observed since the detector is the human eye. However, emission that generate lines in the Ultraviolet and Infrared energy are observed in our experiment.
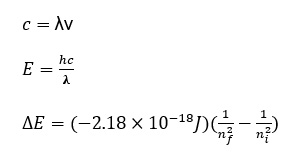
Useful Formulas:

Important Note: nfinal and ninitial must be in correct order. A change in energy can be positive or negative.

And for Rydberg equation, n2 > n1. But you can't have a negative distance, so this one isn't as critical to get the various n in the correct order.
Procedure and Questions:
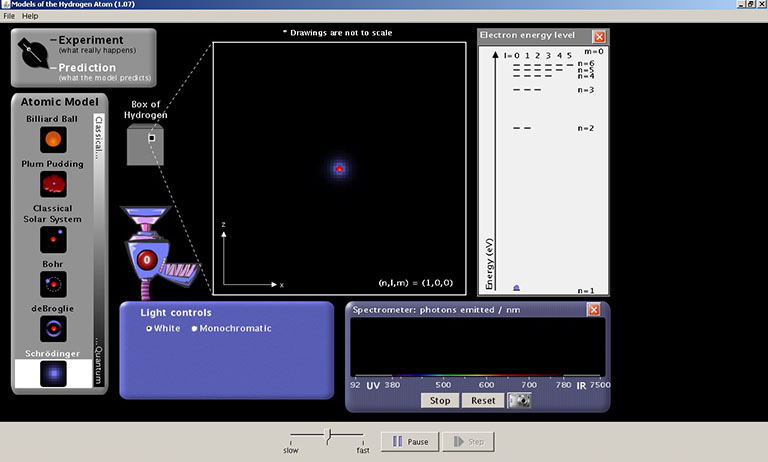
Start the Models of the Hydrogen Atom simulation.
Turn on the White light gun. The white light shining into a transparent box containing hydrogen gas. This is the "?-box." The gas molecules have been ionized so hydrogen atoms are present, but the scientists cannot see these individual atoms (hence the "?"). It is possible however to send the light into the box and record the light that is emitted from the box.
To record the photons of light emitted from the transparent box check the "Show Spectrometer" box. Notice that the color of the photons being emitted from the box corresponds to a wavelength of UV, visible, or IR radiation.
On the Slow...Fast slider, slide to the fast end of the scale.
Run this simulation for at least 5 minutes on fast.
Move the Slow...Fast slider all the way to Slow.
Watch the photons carefully. Most of the light gun photons pass through the box of hydrogen unaffected. Occasionally something happens in the "?-box" and a photon is emitted. Note: The emission is recorded on the spectrophotometer.
Take a snapshot of your experimental data—the emission spectrum. Use the camera at the bottom of the spectrophotometer.
Experimental Data:
Question 1:
From the emission spectrum generated in the experiment (the "?-box"), briefly identify:
the colors; and
the approximate wavelengths of the H atomic spectrum in your "?-box." (The relative amount of the light (stacked boxes) is generally related to how long you run the experiment.)
Questions 2 - 4:
If a photon of monochromatic light has a wavelength of 94 nm, what is its frequency per second or Hz, s-1?
What is the energy (J) of one photon?
What is the energy of one mol of photons at 94 nm?
For the remainder of this exercise, set-up your prediction screen, open the electron energy diagram, and use the spectrometer to record the emitted photons.

Use Dalton's Billiard Ball Model:
A brilliant model which is still useful but which was also wrong about an atom being non-divisible (smallest particle). However, it is still true that the atom is unique. I think the idea that the atom is the smallest particle that 'retains all the characteristics of that element' is still true. We now know that an atom consists of many smaller particles. In this class, we study the electrons, principally. "Valence Electrons" are the particles involved in chemical reactions.
Take a couple of minutes to look at the "Billiard Ball" model.
Question 5:
Why doesn't anything appear on an emission spectrum in Dalton's "Billiard Ball" model?
Use Rutherford's Classical Solar System Model:
Switch to Rutherford's Model. Be sure to slow this all the way down.
Question 6:
Briefly speculate why the electron loses energy and spirals into the nucleus.
Comment: What does this mean to our model? It means that the electron must have its own 'ground-state' energy that resists/prevents the destruction of the atom.
Use Bohr Model:
Switch to the Bohr Model and Run this simulation on fast for at least 5 minutes to compare to your snapshot of the experimental electromagnetic spectrum. Be sure to take a snapshot for later comparison to experimental results.
Questions 7:
Use transition from n = 2 to n = 3 (at 655 nm) to calculate the following:
The frequency of the wavelength
The Energy of the wavelength using Plank's Constant
The Change in Energy, ΔE, of the transition (from n = 2 to n = 3)
Now calculate predicted wavelength of energy emitted (from n = 3 to n = 1) using Rydberg's equation.
The atom will emit a wavelength of light energy in the transition from n = 3 to n = 1. In two to three sentences explain what happens when the atoms absorb a photon and what happens when it emits a photon.
Using the Slow...Fast Slider, slow the speed down and answer the following questions. To aid in your analysis, click on "Show Electron Energy Diagram."
Questions 8 - 10:
What happens to the electron when a photon hits the electron?
Does anything happen in the Emission Spectrum when the photon hits (or is absorbed)?
What happens IN THE EMISSION Spectrum when the photon returns to a lower energy level or the ground-state?
Question 11:
Compare the Experimental Emission Snapshot and Bohr Model Snapshot.
Is the Bohr Model spectrum 'right'? Briefly describe why or why not.
Use Schrodinger's Model:
You may need to run this simulation on fast for more than 5 minutes.
This is a more sophisticated model than Bohr's. When an electron interacts with the atom, the simulation shows the 'shape' of the orbital cloud. We have seen these as quantum numbers.
When l = 0 (or s), the shape is a sphere;
When l = 1 (or p), the shape is similar to a barbell.
When l = 2 (or d) the shape is similar to a cloverleaf.
Notice that the shape is larger when the 'n' is larger.
Question 12:
(Highlight all correct answers.)
There is a nucleus.
The electron is a particle in a well-defined orbit.
The position of the electron is represented in an ambiguous manner. Different areas are shaded.
Question 13:
The electron energy level diagram in the Schrodinger Model, is more complicated than the energy level diagram in the Bohr Model. Identify the quantum numbers (n and l) and the shapes for areas at n = 2 in the Schrodinger Model.
Question 14:
Compare the experimental spectrum snapshot to Spectrum generated by the Schrodinger Model. Is this model 'right'?
This is a modified version of a lab written by Dr. Ted M. Clark at Ohio State University.